For this tutorial series, we will be using the genlight object that we created in the previous tutorial. Original data in HapMap format used in TASSEL was converted to genlight object. Here b will be our genlight object that we previously created in Tutorial P01.
Import library
library(LDcorSV)
library(adegenet)
library(ggplot2)
library(scales)
library(tidyverse)
library(dpaudelR)
Import library to draw phylogenetic tree
library(ape)
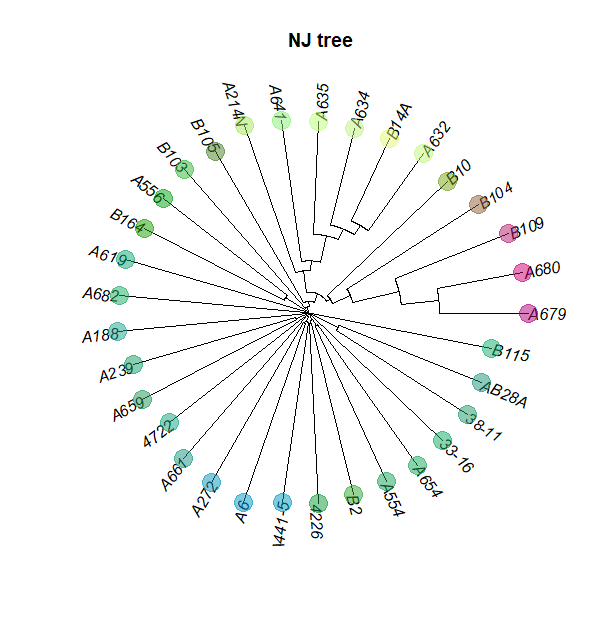
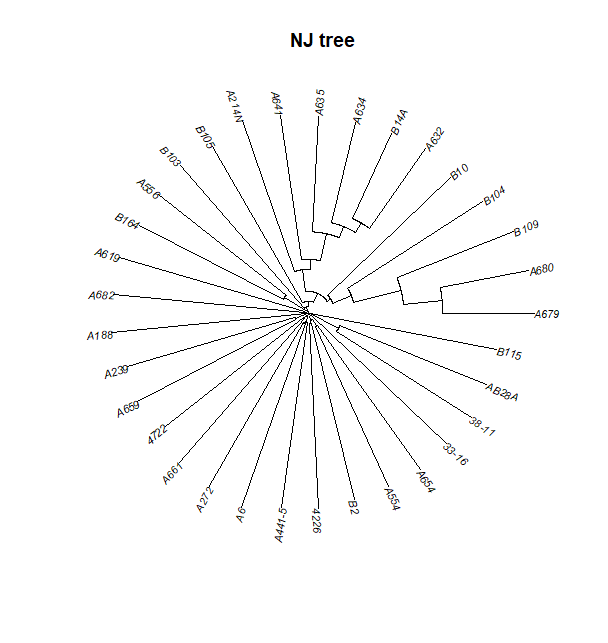
Create tree
tre <- nj(dist(as.matrix(b)))
Plot the Neighbor Joining tree
plot(tre, typ="fan", cex=0.7)
title("NJ tree")
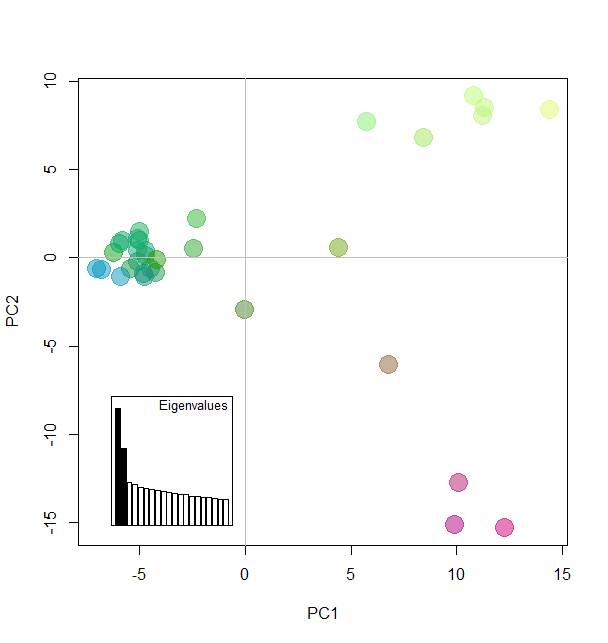
Add colors according to Principal components
myCol <- colorplot(pca1$scores,pca1$scores, transp=TRUE, cex=4)
plot(tre, typ="fan", show.tip=FALSE)
tiplabels(pch=20, col=myCol, cex=4)
title("NJ tree ")