For this tutorial series, we will be using the genlight object that we created in the previous tutorial. Original data in HapMap format used in TASSEL was converted to genlight object.
Install package
devtools::install_github("dpaudel/dpaudelR")
Load required package
library(LDcorSV)
library(adegenet)
library(ggplot2)
library(scales)
library(tidyverse)
library(dpaudelR)
Download data
For this tutorial, we will be using hapmap data that comes with TASSEL. The data can be downloaded from this link:
https://raw.githubusercontent.com/dpaudel/TASSELtutorial/master/data/mdp_genotype_subset.hmp.txt
Save the data in your computer.
Import data
mygeno=hapMap2genlight2(file.choose()) # Choose the hapmap file that you just downloaded
Get the genlight object for DAPC
mygeno1 <- mygeno[[1]]
Remove NA
toRemove <- is.na(glMean(x, alleleAsUnit = FALSE)) # TRUE where NA when Error in glPca(flu) : NAs detected in the vector of means
which(toRemove) # position of entirely non-typed loci
b <- x[, !toRemove]
Plot the eigen values
glPca(b)
# Select the number of axes as 20

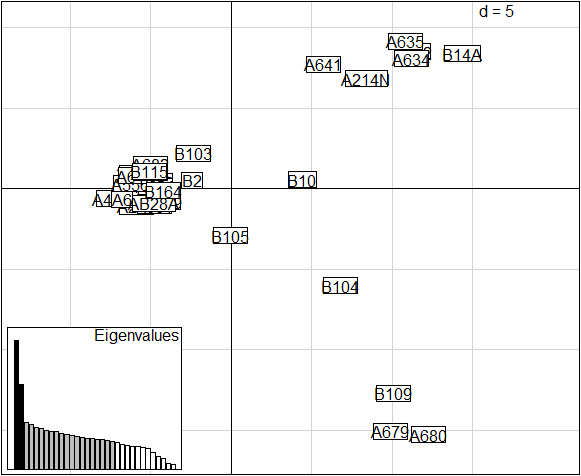
Plot the PCA
pca1 <- glPca(b)
scatter(pca1, posi="bottomleft")
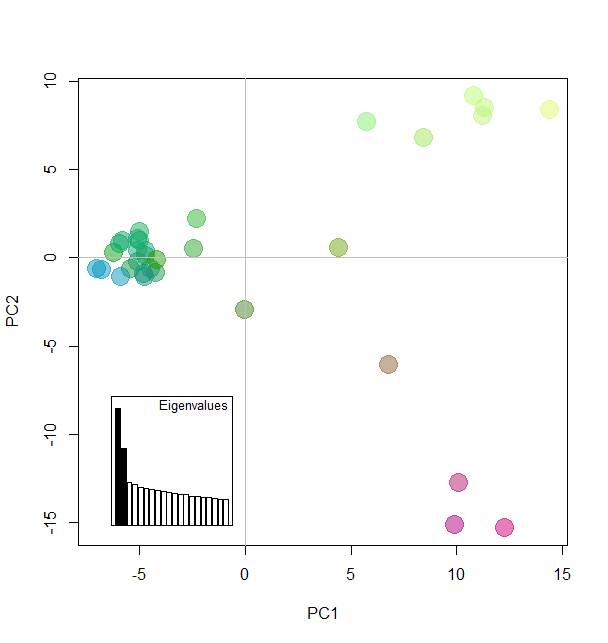
Colorplot
myCol <- colorplot(pca1$scores,pca1$scores, transp=TRUE, cex=4)
abline(h=0,v=0, col="grey")
add.scatter.eig(pca1$eig[1:20],2,1,2, posi="bottomleft", inset=.18, ratio=.2)