Analysis of Variance (ANOVA) is a statistical method used to test differences between two or more means. ANOVA is used to test general rather than specific differences among means.
Load packages
library(tidyverse)
library(agricolae)
## Warning: package 'agricolae' was built under R version 3.3.3
Read input data
irisdata<-read_csv("irisdata.csv")
## Parsed with column specification:
## cols(
##   Sepal.Length = col_double(),
##   Sepal.Width = col_double(),
##   Petal.Length = col_double(),
##   Petal.Width = col_double(),
##   Species = col_character()
## )
Inspect input data
str(irisdata)
## Classes 'tbl_df', 'tbl' and 'data.frame':	150 obs. of  5 variables:
##  $ Sepal.Length: num  5.1 4.9 4.7 4.6 5 5.4 4.6 5 4.4 4.9 ...
##  $ Sepal.Width : num  3.5 3 3.2 3.1 3.6 3.9 3.4 3.4 2.9 3.1 ...
##  $ Petal.Length: num  1.4 1.4 1.3 1.5 1.4 1.7 1.4 1.5 1.4 1.5 ...
##  $ Petal.Width : num  0.2 0.2 0.2 0.2 0.2 0.4 0.3 0.2 0.2 0.1 ...
##  $ Species     : chr  "setosa" "setosa" "setosa" "setosa" ...
##  - attr(*, "spec")=List of 2
##   ..$ cols   :List of 5
##   .. ..$ Sepal.Length: list()
##   .. .. ..- attr(*, "class")= chr  "collector_double" "collector"
##   .. ..$ Sepal.Width : list()
##   .. .. ..- attr(*, "class")= chr  "collector_double" "collector"
##   .. ..$ Petal.Length: list()
##   .. .. ..- attr(*, "class")= chr  "collector_double" "collector"
##   .. ..$ Petal.Width : list()
##   .. .. ..- attr(*, "class")= chr  "collector_double" "collector"
##   .. ..$ Species     : list()
##   .. .. ..- attr(*, "class")= chr  "collector_character" "collector"
##   ..$ default: list()
##   .. ..- attr(*, "class")= chr  "collector_guess" "collector"
##   ..- attr(*, "class")= chr "col_spec"
Convert into factors
Since Species is not a factor, we will convert it into a factor:
irisdata$Species <- as.factor(irisdata$Species)
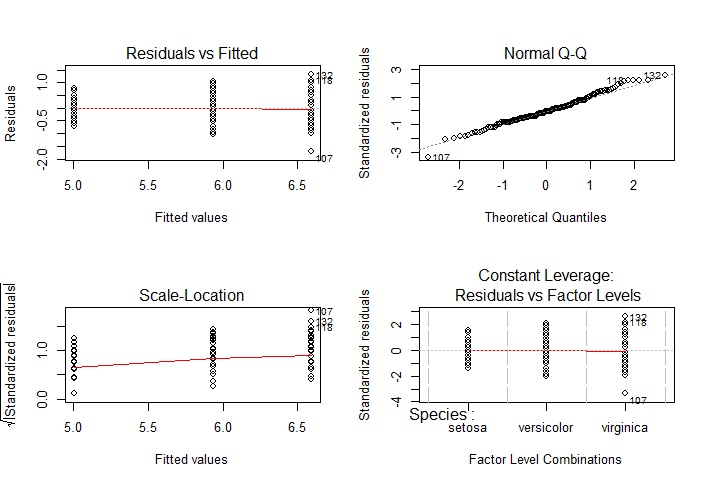
Fit a model and view residuals
ANOVA tests the non-specific null hypothesis that all three population means are equal. Here, our question is, does sepal length differ between species?
model1 <- aov(Sepal.Length ~ Species, data=irisdata)
par(mfrow=c(2,2))
plot(model1)
Get summary of model
summary(model1)
##              Df Sum Sq Mean Sq F value Pr(>F)
## Species       2  63.21  31.606   119.3 <2e-16 ***
## Residuals   147  38.96   0.265
## ---
## Signif. codes:  0 '***' 0.001 '**' 0.01 '*' 0.05 '.' 0.1 ' ' 1
This shows that there is statistically significant difference in Sepal Length between the species, but with ANOVA, we can not distinguish which Species are significantly different than other Species.
To find this out, we need to perform a post-hoc test like Tukey HSD, which is discussed in the next post.
<– Click here to go to the previous tutorial Click here to go to the next tutorial –>